User | Initial Prompt
Develop a hypothesis and test plan for the color of an “add to cart” call to action
Product Testing Mentor | Optimize. Test. Innovate.
Developing a hypothesis and test plan for evaluating the impact of the color of an “Add to Cart” call to action (CTA) button on a website involves several steps. Let’s break down the process:
-
Hypothesis Development
Hypothesis Statement: “The color of the ‘Add to Cart’ CTA button significantly affects the click-through rate (CTR) and, consequently, the conversion rate of users on the product page.”
This hypothesis is based on the premise that certain colors can evoke different emotional responses and actions from users. For instance, a brighter color might be more noticeable and encouraging, leading to higher engagement.
-
Variables
- Independent Variable: Color of the “Add to Cart” button (e.g., red, blue, green).
- Dependent Variable: Click-through rate of the “Add to Cart” button.
- Control Variables: Page layout, product type, price, description, and all other elements of the website should remain constant to ensure that any change in CTR is attributable to the button color.
-
Test Design
- Control Group (A): The current color of the “Add to Cart” button.
- Test Group (B): The new color proposed for the “Add to Cart” button.
-
Sample Size and Duration
- Calculate the required sample size using a statistical power analysis, considering the baseline conversion rate and the minimum detectable effect (MDE) you aim to observe.
- The duration of the test should be long enough to gather sufficient data, typically a few weeks, depending on your website’s traffic.
-
Data Collection and Metrics
- Primary Metric: Click-through rate on the “Add to Cart” button.
- Secondary Metrics: Conversion rate (purchases), time spent on the product page, bounce rate, etc.
-
Execution
- Implement the test on your website, ensuring that visitors are randomly assigned to either the control or test group.
- Ensure that all technical aspects (like browser compatibility, mobile responsiveness) are in place for accurate data collection.
-
Data Analysis
- Use statistical methods (like a t-test) to compare the CTR between the two groups.
- Check if the results are statistically significant (p-value < 0.05).
-
Interpretation and Action
- If the test group shows a significantly higher CTR, consider adopting the new color for the CTA button.
- If there’s no significant difference or the control performs better, retain the existing color.
-
Further Testing
- Depending on the results, you might want to test other colors, combinations, or even different elements like button shape or text.
-
Ethical Considerations and Privacy
- Ensure that all user data is collected and handled in compliance with privacy laws and ethical standards.
- Inform users, if necessary, that their data is being used for website optimization purposes.
This test plan follows a structured approach to determine the impact of CTA button color on user behavior, providing actionable insights while maintaining rigorous scientific and ethical standards.
User | Initial Prompt
How will we know if we have reached statistical significance with this test?
Product Testing Mentor | Optimize. Test. Innovate.
To determine if your A/B test for the “Add to Cart” call-to-action (CTA) button color has reached statistical significance, you’ll need to analyze the collected data using statistical methods. Here’s a step-by-step approach:
-
Define Statistical Significance Level
First, decide on the level of statistical significance you’re aiming for. Commonly, a p-value of 0.05 (or 5%) is used. This means there’s a 5% chance that the observed difference in click-through rates (CTR) between the two button colors is due to random chance, rather than the change in color.
-
Choose the Right Statistical Test
For an A/B test comparing two proportions (like CTR in this case), a two-proportion z-test is typically used. This test compares the CTR of the control group (current color) and the test group (new color) to see if there is a statistically significant difference.
-
Collect Data
Ensure you have collected enough data to have a statistically valid result. This is where your sample size calculation, done prior to starting the test, is critical. The sample size should be large enough to detect a meaningful difference, taking into account your baseline conversion rate and the desired minimum detectable effect.
-
Calculate the Test Statistic
With your data collected, calculate the z-score using the CTRs from both groups. The formula for the z-score in a two-proportion z-test is:
where,
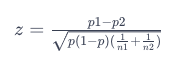
- p1 = CTR of the test group.
- p2 = CTR of the control group.
- n1 and n2 are the sample sizes of the test and control groups, respectively.
- p is the pooled probability, calculated as
 , where x1 and x2 are the number of successes (clicks) in the test and control groups.
-
Determine the P-Value
The p-value is the probability of observing a test statistic as extreme as, or more extreme than, the one calculated, under the null hypothesis (which states that there’s no difference in CTRs between the two groups). You can find the p-value using a z-table or statistical software.
-
Interpret the Results
- If the p-value is less than 0.05, you can reject the null hypothesis and conclude that the change in button color has a statistically significant effect on CTR.
- If the p-value is greater than 0.05, you fail to reject the null hypothesis, meaning there’s not enough evidence to say the color change significantly affects CTR.
-
Consider Other Factors
- Confidence Intervals: Alongside the p-value, look at the confidence interval for the difference in proportions. This gives you a range of plausible values for the true difference.
- Practical Significance: Even if a result is statistically significant, consider if the difference is large enough to be meaningful in a business context.
- Test Validity: Ensure that the test was run correctly without any biases or confounding variables.
Remember, statistical significance is just one part of the decision-making process. It should be combined with business judgment and consideration of other qualitative factors before making a final decision on which color to use for the CTA button.
User | Initial Prompt
What is the sample size calculation? Can you provide a formula?
Product Testing Mentor | Optimize. Test. Innovate.
Certainly! The sample size calculation for an A/B test, such as testing different colors for an “Add to Cart” button, is crucial to ensure that the test has enough power to detect a meaningful difference between the two variations if one exists. The formula for calculating sample size in an A/B test considering two proportions (like click-through rates) is derived from the principles of hypothesis testing and power analysis.
Sample Size Calculation Formula
The formula to calculate the sample size for each group in an A/B test is:
where,
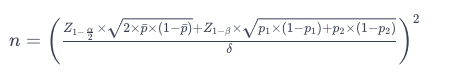
- n is the sample size per group (control and test).
 is the z-score associated with the desired confidence level (e.g., 1.96 for 95% confidence).
- α is the significance level (commonly 0.05 for a 5% significance level).
- is the z-score associated with the desired power of the test (e.g., 0.84 for 80% power).
- β is the probability of Type II error (commonly 0.2 for 80% power).
- p is the pooled probability, calculated as

- are the expected conversion rates for the control and test groups, respectively.
- δ is the minimum detectable effect (MDE), the smallest difference in conversion rates you want to detect (e.g., 0.03 for a 3% difference).
Explanation and Usage
The formula to calculate the sample size for each group in an A/B test is:
- Significance Level (α): Commonly set at 0.05, this represents the probability of a Type I error, or false positive.
- Power (1-β): Often set at 0.80 or 80%, this is the probability of correctly rejecting the null hypothesis when it is false (i.e., detecting a true effect).
- Expected Conversion Rates (p1 and p2): These are your estimates of the conversion rates for the control and test group.
- Minimum Detectable Effect (δ): This is the smallest change in conversion rates that is practically significant for your test.
To use this formula, you’ll need to plug in these values based on your specific test and goals. The resulting sample size will tell you how many observations (users, clicks, etc.) are needed in each group to have a high likelihood of detecting the effect you’re interested in, assuming it exists.
Remember, this formula assumes a basic two-group test under certain conditions (like normality and equal variances). If your test conditions differ significantly, you may need a more specialized approach to sample size calculation.
User | Initial Prompt
What would the needed sample size be if this page containing the cta has 500,000 pageviews per week?
Product Testing Mentor | Optimize. Test. Innovate.
To determine the required sample size for your A/B test, we need more information than just the total number of pageviews. Specifically, we need to define:
- Baseline Conversion Rate (p1): The current conversion rate of the page with the existing CTA button color.
- Minimum Detectable Effect (δ): The smallest change in conversion rate that you consider to be meaningful for your business.
- Desired Significance Level (α): Commonly set at 0.05.
- Desired Power (1 - β): Typically 0.80 or 80%.
However, given the high volume of traffic (500,000 pageviews per week), it’s likely that even a relatively small A/B test will reach statistical significance if there’s a real effect to be detected. Let’s do a hypothetical calculation with some typical values for these parameters:
- Baseline Conversion Rate (p1): Assume 2% (0.02).
- Minimum Detectable Effect (δ): Assume you want to detect a 0.5% absolute increase in the conversion rate.
- Significance Level (α): 0.05.
- Power (1-β): 0.80.
Using these values, I will calculate the required sample size for each group in your A/B test. Let’s proceed with the calculation.
Based on the assumed parameters, you would need approximately 13,809 participants in each group (control and test) to detect a 0.5% absolute increase in the conversion rate from a baseline of 2%, with a significance level of 0.05 and a power of 0.80.
Given that your page receives 500,000 pageviews per w*eek, achieving this sample size should be feasible within a relatively short time frame, depending on what percentage of pageviews actually interact with the “Add to Cart” button. Remember, the calculated sample size refers to the number of users who actually see and have the opportunity to interact with the CTA, not just the total pageviews.
Try Product Testing Mentor or Learn more


Create a single page checkout flow
How to implement sustainable design practices?